The world is going to need more gas.
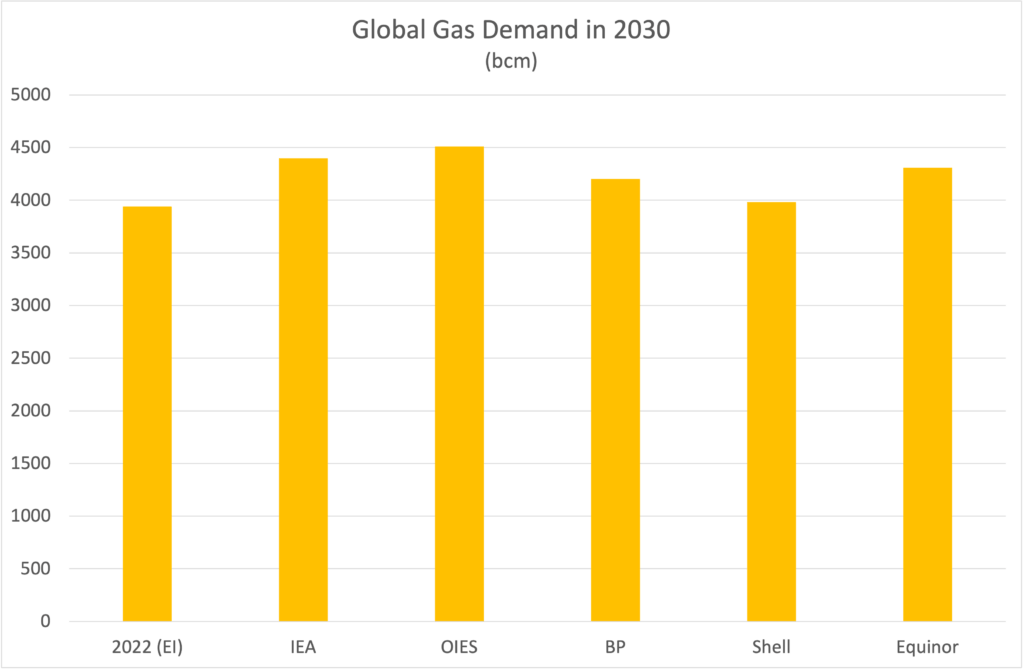
All baseline scenarios agree that global gas demand is not going down before the end of this decade.
The lowest projection comes from Shell, which foresees global gas demand to reach around 3,983 billion cubic meters (bcm) by 2030.
This is 42 bcm more than in 2022.
All other baseline scenarios project a gas demand of more than 4,000 bcm of natural gas in 2030.
The highest demand projection comes from the Oxford Institute for Energy Studies, reaching 4,512 bcm.
In all instances, except for Shell, this would be the highest gas consumption ever and a clear reversal of the short-term demand reduction from 2021 to 2022.
Even a more ambitious energy transition would not necessarily bring down gas demand.
At least two scenarios – by BP and Equinor – foresee rising gas consumption until 2050 even in moderately climate-friendly scenarios.
(All scenarios project declining consumption in an actual net-zero pathway. But no one assumes such a pathway to become reality.)
More Infrastructure is Required
Analysts currently dispute if existing investments suffice to satisfy this growing demand.
The IEA assumes that current investments in gas production would leave a supply gap of 720 bcm until the end of the decade.
To balance the market, overall investments would have to reach $ 280 bn per year in the baseline scenario.
This would still be $ 240 bn per year if governments would actually implement all their climate promises.
Even in a – highly unlikely – net zero pathway, gas companies would still have to invest $ 200 bn every year to keep output from existing fields stable.
While several business leaders and policy makers agree that investments in gas are insufficient, others contest the idea.
Private energy analysts Rystadt Energy and Wood Mackenzie argue that fears of underinvestment rest on an overly linear understanding of oil and gas production.
In their view, productivity gains and cost reductions are going to reduce investments requirements significantly.
Based on this, current levels are more than sufficient to satisfy expected demand.
But notwithstanding such disputes – everyone agrees that gas markets are going to remain strong and require significant investments until at least 2050.
LNG Will Become More Important
Liquified Natural Gas (LNG) is likely to cover an increasing share of this overall growing market.
The sector is looking at opportunities for exponential growth, with the Oxford Institute for Energy Studies (OIES) predicting an addition of 350 bcm.
This would be an increase of 60% from 2022 to 2030.
Such a growth rate would bring LNG’s share in covering global gas demand up to 22% from the almost 16% it covered in 2022.
(Actual LNG production in that year was 542.5 bcm or 13.8% of global consumption.)
But even the projects that are already confirmed or very likely to start production until 2028 will support a significant increase in LNG’s market share.
Let’s look at some numbers.
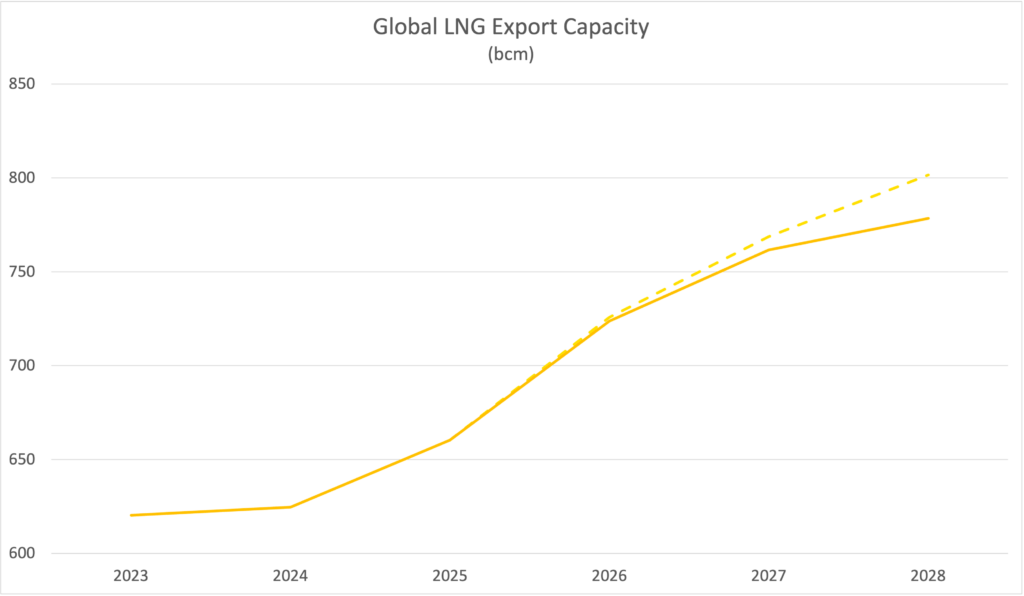
As said above, global liquefaction capacity in 2022 stood at 449.8 million tons per year (mtpa) or 620.3 bcm, enough to cover 15.7% of worldwide demand.
Projects that are already under construction or at least fully committed will add 253.9 bcm until 2028.
This would bring overall capacity up to 874.2 bcm, expanding global liquefaction capacity by 46.8%.
Hence, the possible share of LNG in covering global gas demand could rise up to 19.9%, implying a significant increase in market share.
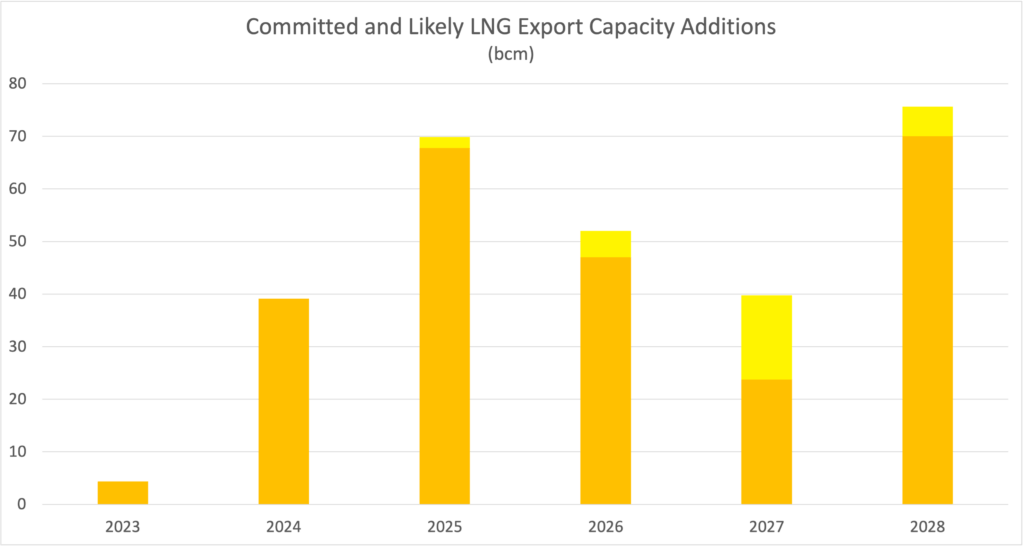
Most of these additions will enter the market after 2025, at which point global prices should decline considerably.
Projects that do not yet have reached an FID, but are likely to get one, could add further 39.6 bcm to global liquefaction capacity, taking it up to 913.8 bcm.
This would cover more than one fifth of overall gas demand.
All of this rests on the IEA’s benchmark projection of 4,400 bcm gas demand in 2030, which is – as stated above – in the mid-range of future demand expectations.
In any scenario, and under any definition of liquefaction capacity, LNG supply is going to grow by volume and cover an increasing share of the expanding gas market.
Most New Capacity to Emerge in Qatar and the US
Most of the new confirmed or likely capacity is going to emerge in the US or Qatar.
(The following calculations are based on the assessment of the OIES, combined with capacity data mostly from the Global Energy Monitor (GEM).
Please refer to the last section for a list of the projects and references.)
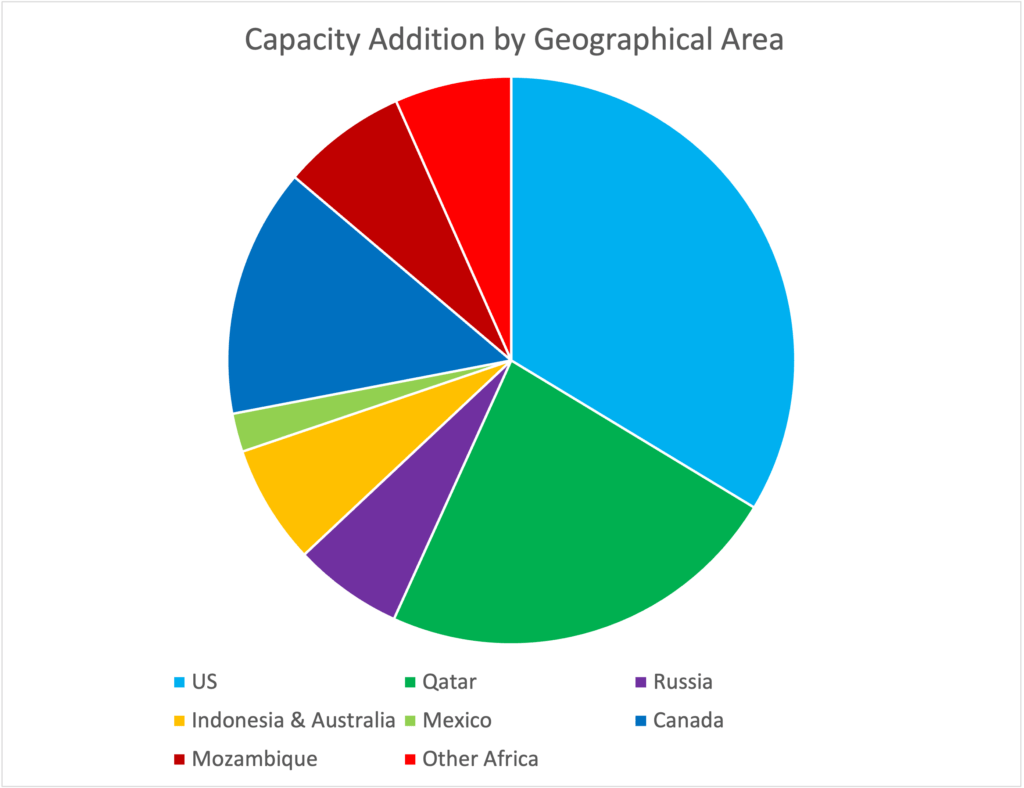
No less than 56.8% of confirmed or likely LNG capacity additions are situated in the US (99.5 bcm or 33.7% of all considered additions) and Qatar (67.6 bcm or 23.1%).
The largest addition outside these two countries comes from Canada with 41.5 bcm or 14.2% of all additions.
No other country covers more than 10% of the expansion.
This includes heavyweights like Australia, whose only confirmed project – Pluto 2 – will add 6.9 bcm to the global LNG supply.
Similarly, Russia’s two confirmed projects – two terminals as part of the Arctic 2 project – will add overall 18.2 bcm to global supplies until 2026.
This amounts to 6.2% of global additions.
(The Arctic 2 project is implemented by Novatek – Russia’s largest private gas company and Gazprom’s most relevant domestic rival.)
Gazprom meanwhile is stuck with the Power of Siberia 2 pipeline to China.
This is the only significant pipeline project that the OIES considers to possibly come online by 2030 – and it is met with disinterest and reluctance by China.
Qatar Energy Dominates LNG-Expansion
The Qatari state company Qatar Energy, formerly known as Qatar Petroleum, is largest contributor to the future LNG expansion.
(Again, this means probably funded projects with expected production start by 2028.)
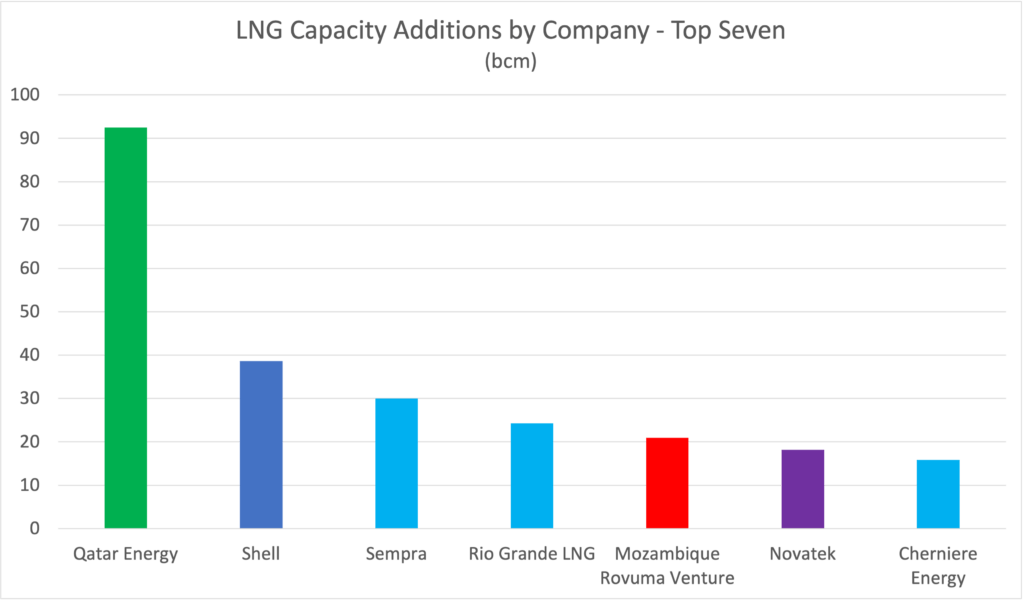
On its own, it accounts for 92.5 bcm of capacity additions or 31.6% of the likely expansion until 2028.
This volume reflects not only the massive addition of 33 bcm in the Qatar North Field Expansion.
It also includes the Golden Pass LNG project in the US, which is supposed to bring 25 bcm of LNG to the market, starting in 2024.
Qatar Energy is the main shareholder of the project with 70%.
Overall, this makes Qatar Energy the company best positioned to profit from the coming LNG expansion.
On a company level, Shell is the next largest contributor, planning to add 38,6 bcm liquefaction capacity until 2025.
This expansion stems exclusively from Canada’s planned LNG project, which Shell runs together with Malaysia’s Petronas, PetroChina, Mitsubishi and South Korean KOGAS.
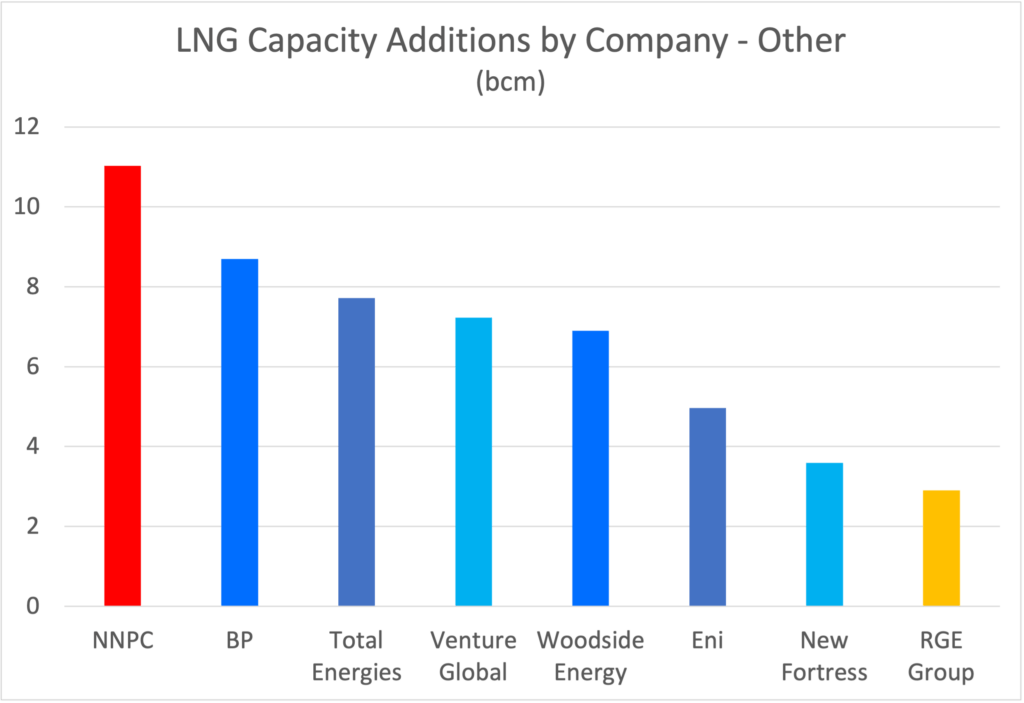
Other European companies play only a minor role as drivers of the LNG capacity growth.
Neither BP nor any EU company controls more than 10 bcm of liquefaction capacity.
(This does not preclude a role as trader or minority shareholder in other projects.
But majority shareholders make the operative decisions and European companies are not prominent in that role).
Altogether, American companies, contribute only 80.9 bcm or 27.7% of the expected capacity addition by 2028, combining the expansion in the US (except Golden Pass) and Mexico.
Outside the West and Qatar, larger additions come especially from Africa.
Among these, the Mozambique Rovuma Venture featuring as one of seven companies with capacity additions above 10 bcm.
The venture is co-run by Exxon Mobil and Eni, both of which own 40% in the firm.
Further partners are the China National Petroleum Corporation, the Portuguese company Galp, and KOGAS.
Mozambique’s state company ENH owns 10% in the overall venture. (Which is 10% more than Canadian companies own in that country’s LNG projects).
Nigerian state company NNPC holds almost half of the planned Train 7 on the country’s Bonny Island Nigeria LNG project, which is planned to bring 11 bcm of LNG to the market by 2026.
Shell, TotalEnergies, and Eni are the other companies in the project.
Concentration Implies Security Risks
From a security perspective, the development is a bit of a mixed bag.
On the one hand, the rising market share of US companies and the stable, but stagnating capacities of Russia are clearly positive from a European perspective.
At the same time, however, the growing share of Qatar and Qatar Energy are problematic, especially in the context of an increasing Qatari-Chinese rapprochement.
Add to this the fact that the largest LNG project in the US is controlled by Qatar Energy, and the situation becomes worrisome.
Australia’s stagnating liquefaction capacities give further cause for concern.
The fact that the currently largest LNG exporter – a developed democracy with high ESG standards and strong security ties to Europe and the US – is dropping to third place is in itself worrying enough.
Combined with the rise of Qatar to become the world’s second largest LNG exporter, this points to the potential for a less democratic, more pro-China supply portfolio.
Importantly, this development occurs at a time when LNG imports are rising throughout Southeast Asia, with Vietnam and the Philippines especially planning to increase their consumption.
Combined with closer Qatari-Chinese gas relations, this is could increase the People’s Republic’s regional clout and complicate Western containment strategies.
To mitigate these risks, European policymakers should…
- accelerate their countries‘ energy transition to free up US LNG supplies for Asian markets.
- retain cooperative relations with Qatar to prevent that country’s slide into China’s orbit.
- conclude negotiations on the EU-Australia Free Trade Agreement quickly and support Australia in reviving its gas and LNG industry.
Workshop Notes: Prices Will Not Decrease Gas Demand
The following is a very simplified discussion that illustrates the fact that market-driven price developments are not going to bring gas demand down.
However strongly one might support the energy transition, it is hard to make a market-based case for replacing gas.
Paul J. Burke and Hewn Yang found in a 2016 paper that for every percentage increase in price, gas demand goes down by 1.25 percent.
Reversely, if price goes down by one percent, gas demand increases by the same amount, implying a price elasticity of 1.25.
Let’s apply this to the IEA’s projection for future gas consumption.
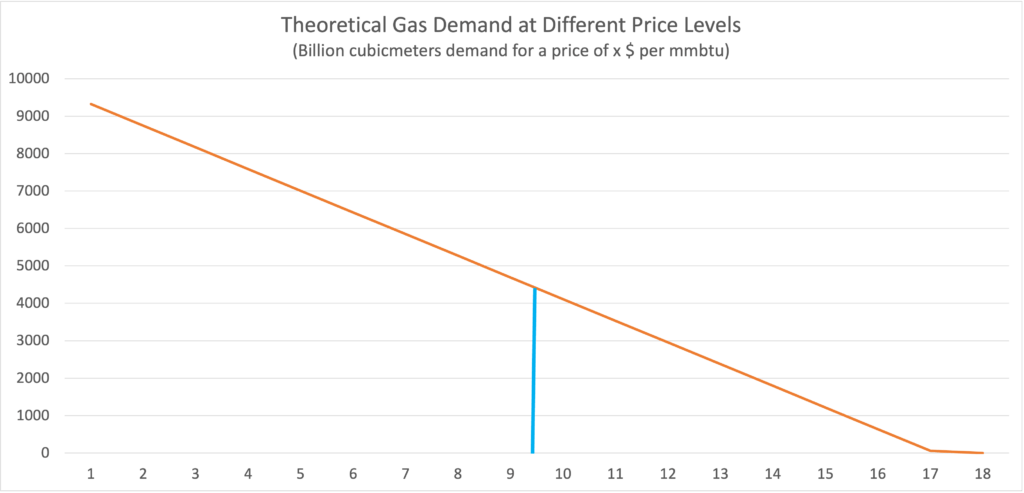
According to the Agency’s baseline STEPS scenario, gas demand will reach 4,400 bcm in 2030 and remain at that level until 2050.
The IEA also projects European gas prices to be at $9.5 per mmbtu in 2030.
Using this as an anchor point for a price elasticity of 1.25 gives an impression of how price changes could impact future gas demand.
Assuming perfect substitutability, gas demand goes to zero at an average price of $17.1 mmbtu.
Perfect substitutabilty does, of course, not exist, which is one reason why gas demand did not go to zero under the much higher prices of the 2022 energy crisis.
It is, therefore, better to interpret this price point as the extreme end of a continuum, with increasing pressure in favor of demand destruction the closer price approach this point.
On the other hand, if prices would fall close to zero – and ignoring any technical framework condition – annual gas consumption could reach up to 11.855 bcm.
This is of course a fantastical number that does, however, illustrate the possible extent that the market could reach in theory if prices were the only relevant factor.
Clearly, such a superficial calculation can only serve as a rough illustration of market dynamics.
But at least it shows that price dynamics are not going to reduce the role of gas in the global energy system.
Quite the opposite: With global prices likely to decline, expect gas demand to revive and grow.
Confirmed and Likely LNG Projects Until 2028
Confirmed LNG Projects with Final Investment Decision
| Start Year | Name | Country | Capacity MTPA | Capacity BCM | Parent Company |
|---|---|---|---|---|---|
| 2023 | Tannguh T3 | Indonesia | 3.8 | 5.24 | BP (40,2%) |
| 2023 | Tango-FLNG Exmar | Republic of Congo | 0.6 | 0.83 | Eni |
| 2024 | Tortue FLNG Phase 1 | Senegal / Mauritania | 2.5 | 3.45 | BP |
| 2024 | Golden Pass | USA | 18.09 | 24.95 | Qatar Energy (70%) |
| 2024 | Arctic 2 LNG T1 | Russia | 6.6 | 9.1 | Novatek (60%) |
| 2024 | New Fortress Fast LNG | USA | 1.2 | 1.66 | New Fortress |
| 2025 | Energia Costa Azul Phase 1 | Mexico | 3.25 | 4.48 | Sempra/Ienova (83.4%) |
| 2025 | Qatar North Field East T1/T2 | Qatar | 16.5 | 22.75 | Qatar Energy (72.5%) |
| 2025 | LNG Canada | Canada | 28 | 38.61 | Shell (40%) |
| 2025 | Altamira FLNG Train 1 | Mexico | 1.4 | 1.93 | New Fortress Energy |
| 2026 | Arctic 2 LNG T2 (Russia) | Russia | 6.6 | 9.1 | Novatek (60%) |
| 2026 | Qatar North Field East T3/T4 | Qatar | 16.5 | 22.75 | Qatar Energy (72.5%) |
| 2026 | FLNG Congo Brazaville | Republic of Congo | 3 | 4.14 | Eni |
| 2026 | NLNG T7 | Nigeria | 8 | 11,03 | NNPC (49%) |
| 2027 | Pluto T2 | Australia | 5 | 6.9 | Woodside Energy |
| 2027 | Corpus Christi Phase 3 | USA | 11.5 | 15.86 | Cherniere Energy |
| 2027 | Plaquemines T1 | USA | 0.74 | 1.02 | Venture Global Plaquemines LNG |
| 2028 | Plaquemines T2 | USA | 0.74 | 1.02 | Venture Global Plaquemines LNG |
| 2028 | Calcasieu Pass Phase 2 | USA | 3.76 | 5.18 | Venture Global Calcasieu Pass LNG |
| 2028 | Port Arthur | USA | 13.5 | 18.62 | Sempra Energy (70%) |
| 2028 | Mozambique T1/T2 | Mozambique | 15.2 | 20.96 | Mozambique Rovuma Venture (70%) |
| 2028 | Rio Grande | USA | 17.6 | 24.27 | Rio Grande LNG |
Projects without Final Investment Decision but likely start year until 2028
| Start Year | Name | Country | Capacity MTPA | Capacity BCM | Parent Company |
|---|---|---|---|---|---|
| 2025 | Woodfibre LNG | Canada | 2.1 | 2.9 | RGE Group |
| 2026 | Cameron Phase 2 | USA | 5 | 6.9 | Sempra LNG (50.2%) |
| 2027 | Qatar North Field South Expansion T5/T6 | Qatar | 16 | 22.06 | Qatar Energy (75%) |
| 2028 | Papua LNG | Papua New Guinea | 5.6 | 7.72 | Total Energies (37.55%) |
Project selection was based on the list by Mike Fullwood in A New Global Gas Order? (Part1): The Outlook to 2030 after the Energy Crisis, Oxford: Oxford Institute for Energy Studies, p. 11.